
Overview
Click the Insight icon in the left menu to access the Insights page. This page lets you analyze your message traffic, costs, and template usage.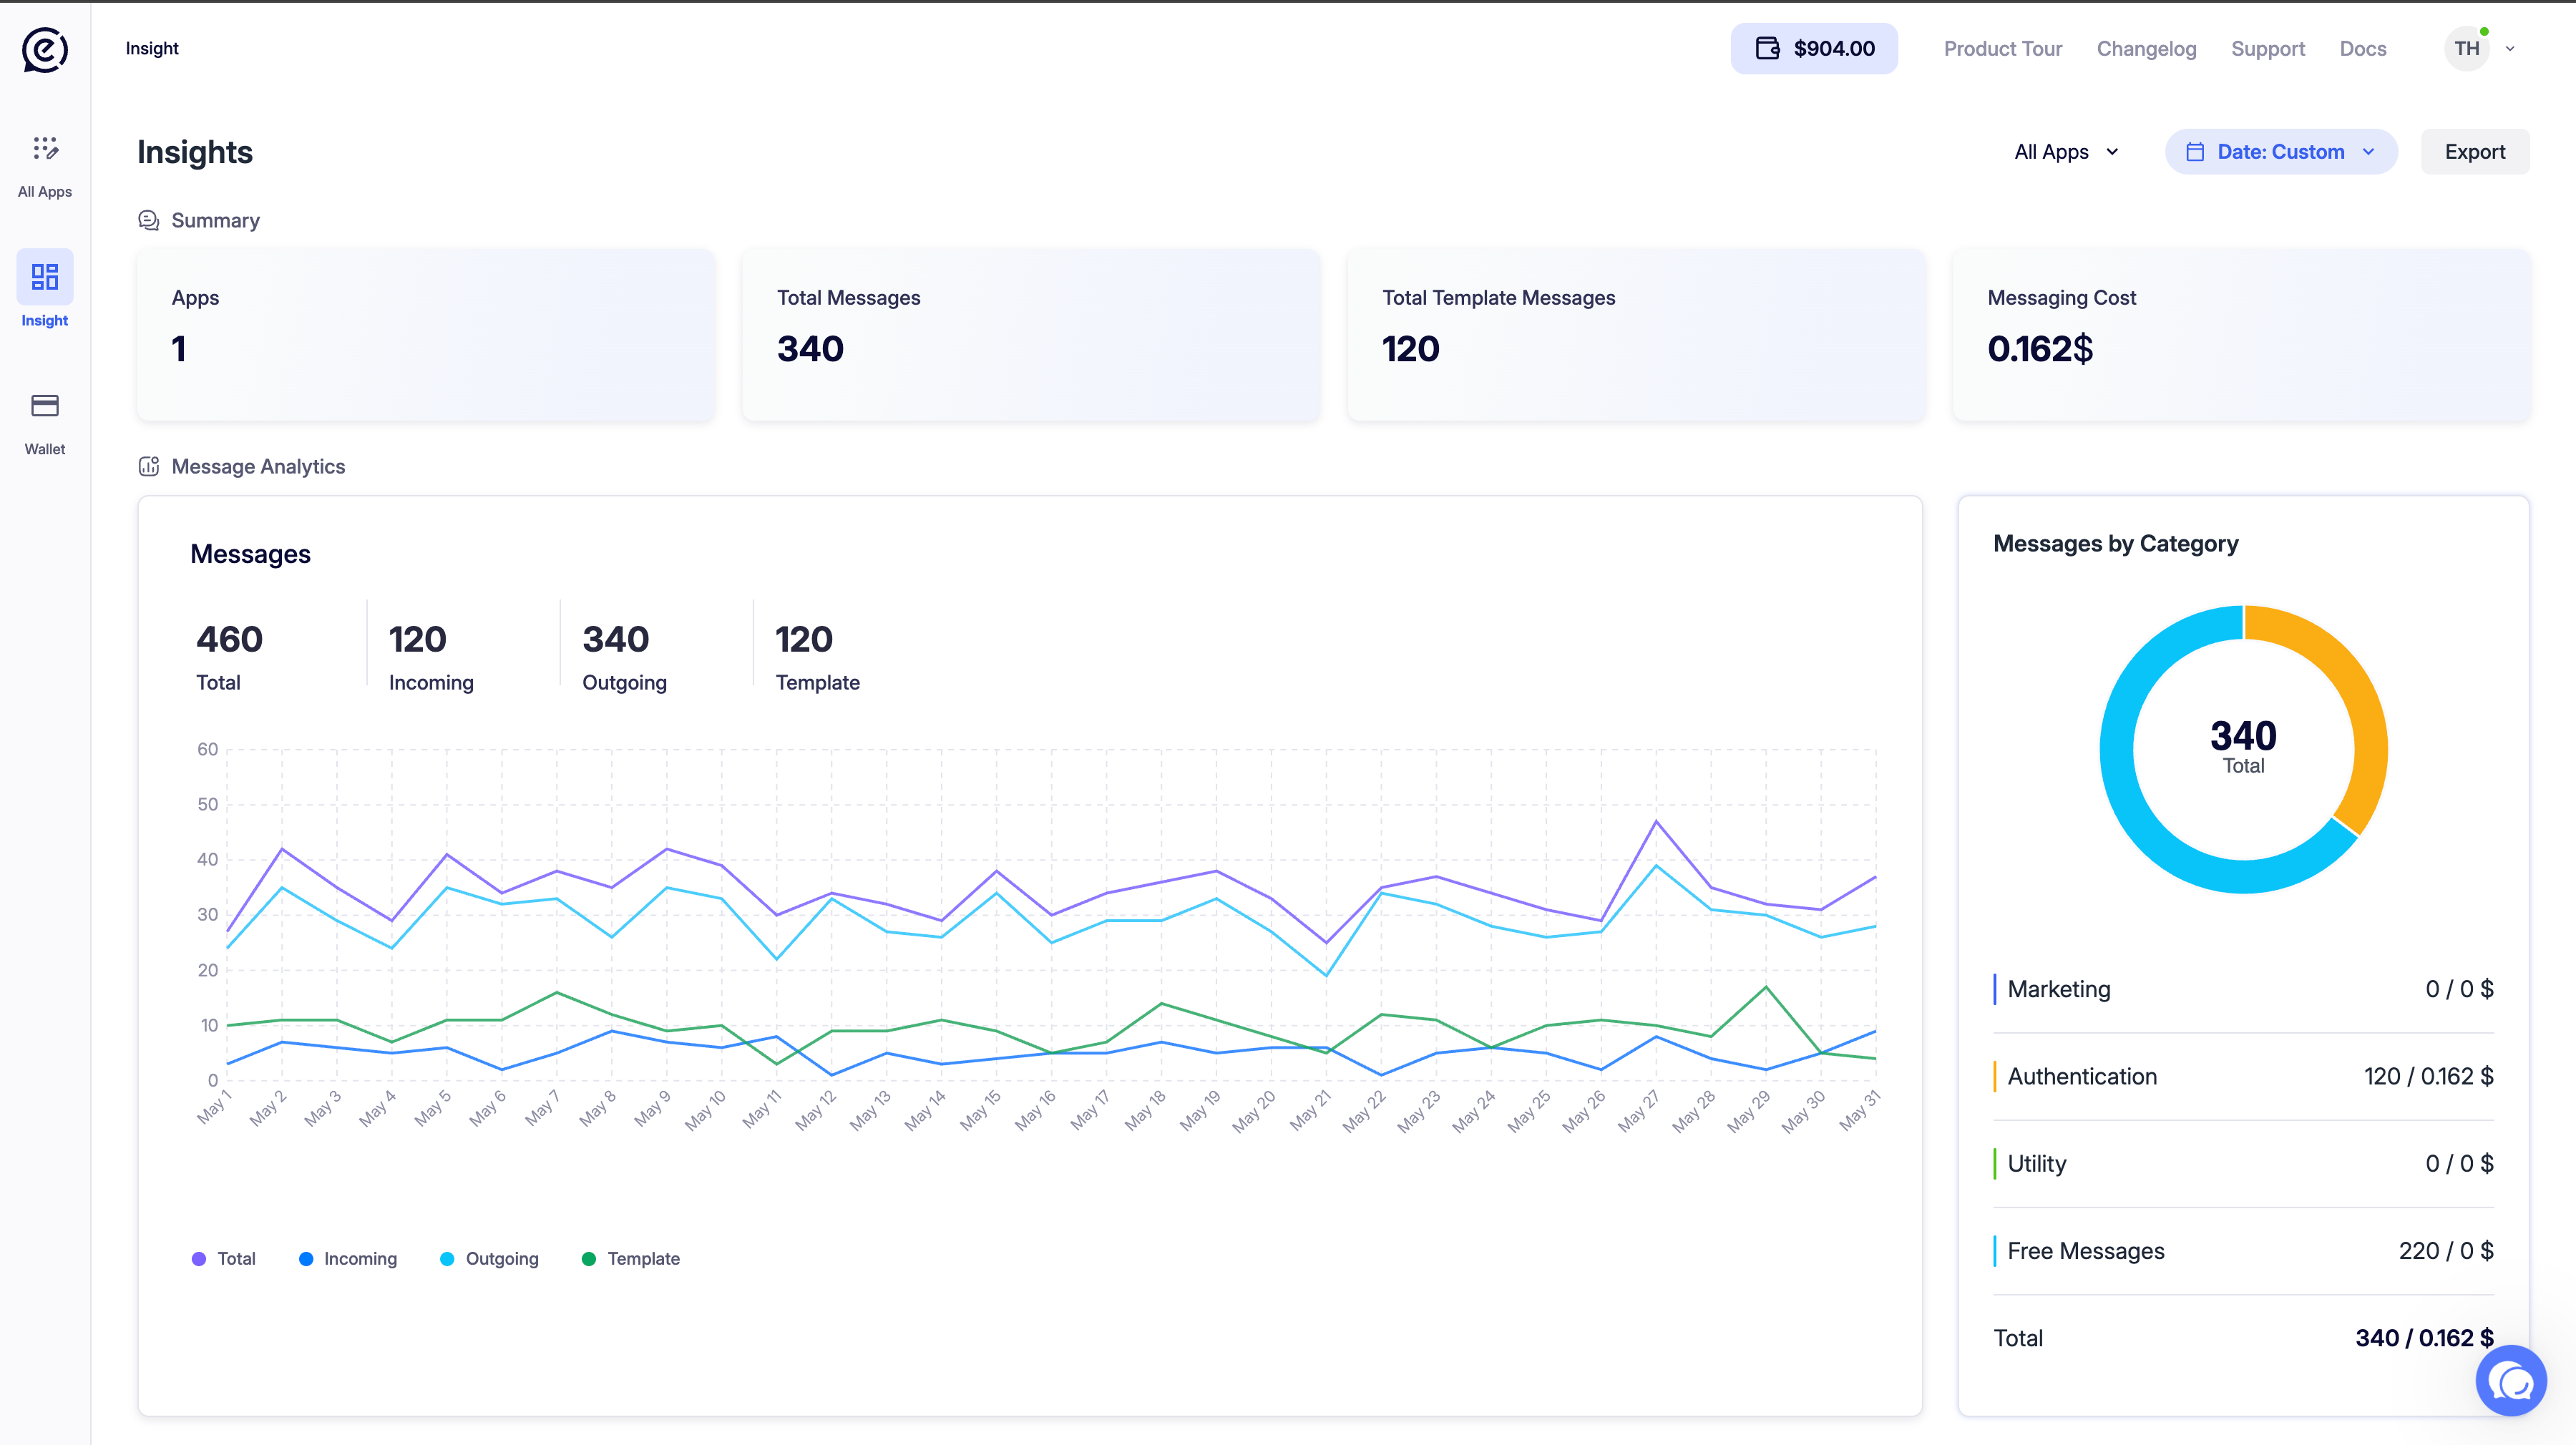
In addition, you can export data using the Export button.
Date Filter
Clicking the Date button opens the date picker.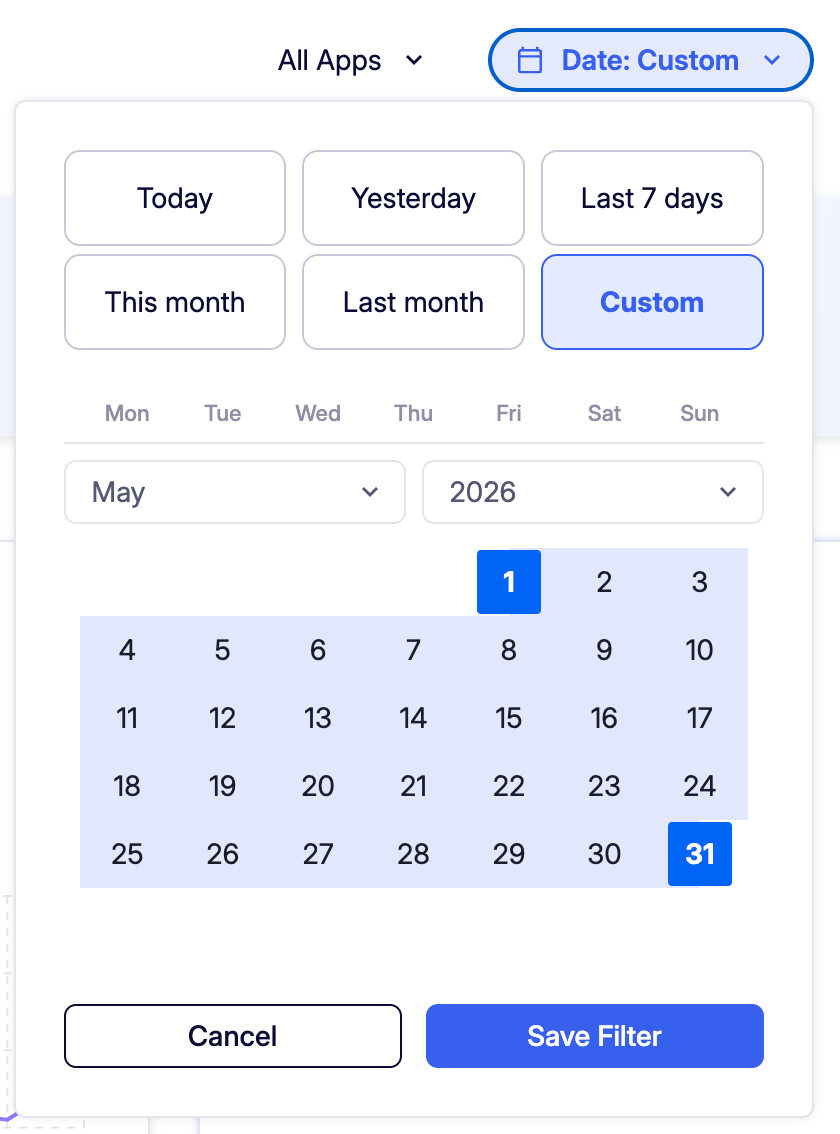
After making your selection, click Save Filter.
Summary
Summary metrics for the selected date range are displayed at the top of the page.
Message Analytics
Messages Chart
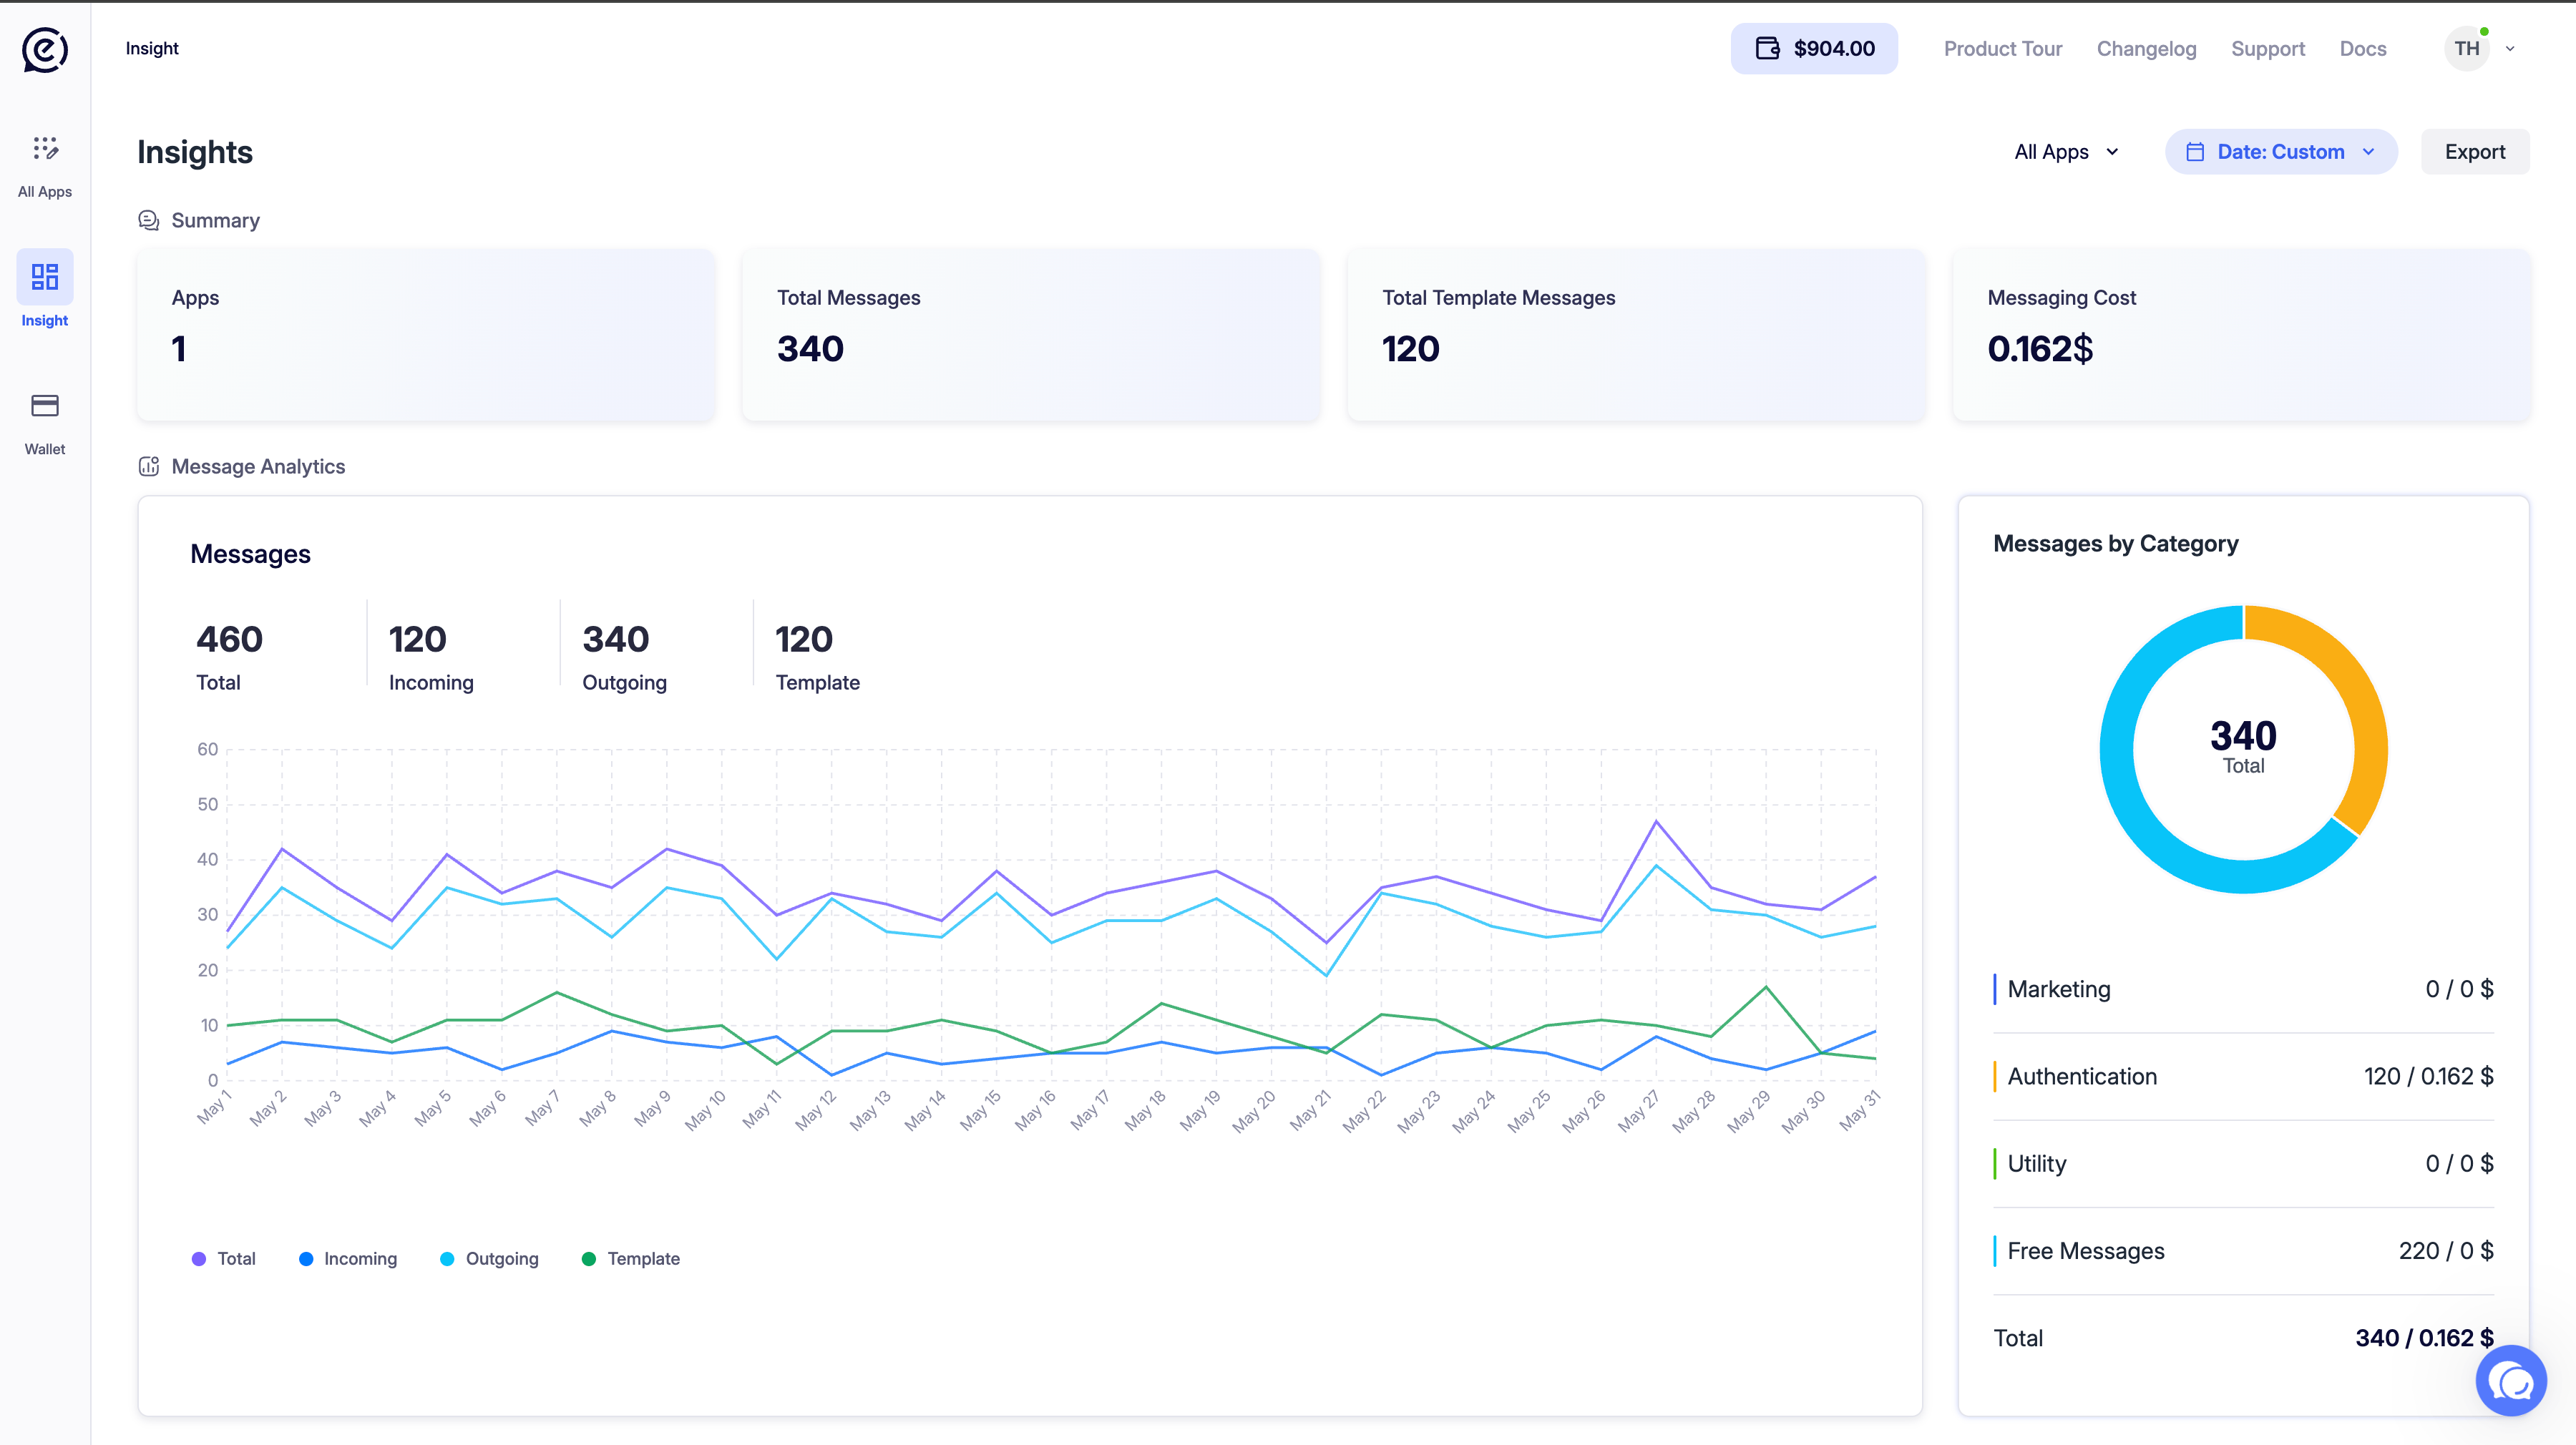
Period totals are shown as a summary above the chart:
Messages by Category (Donut Chart)
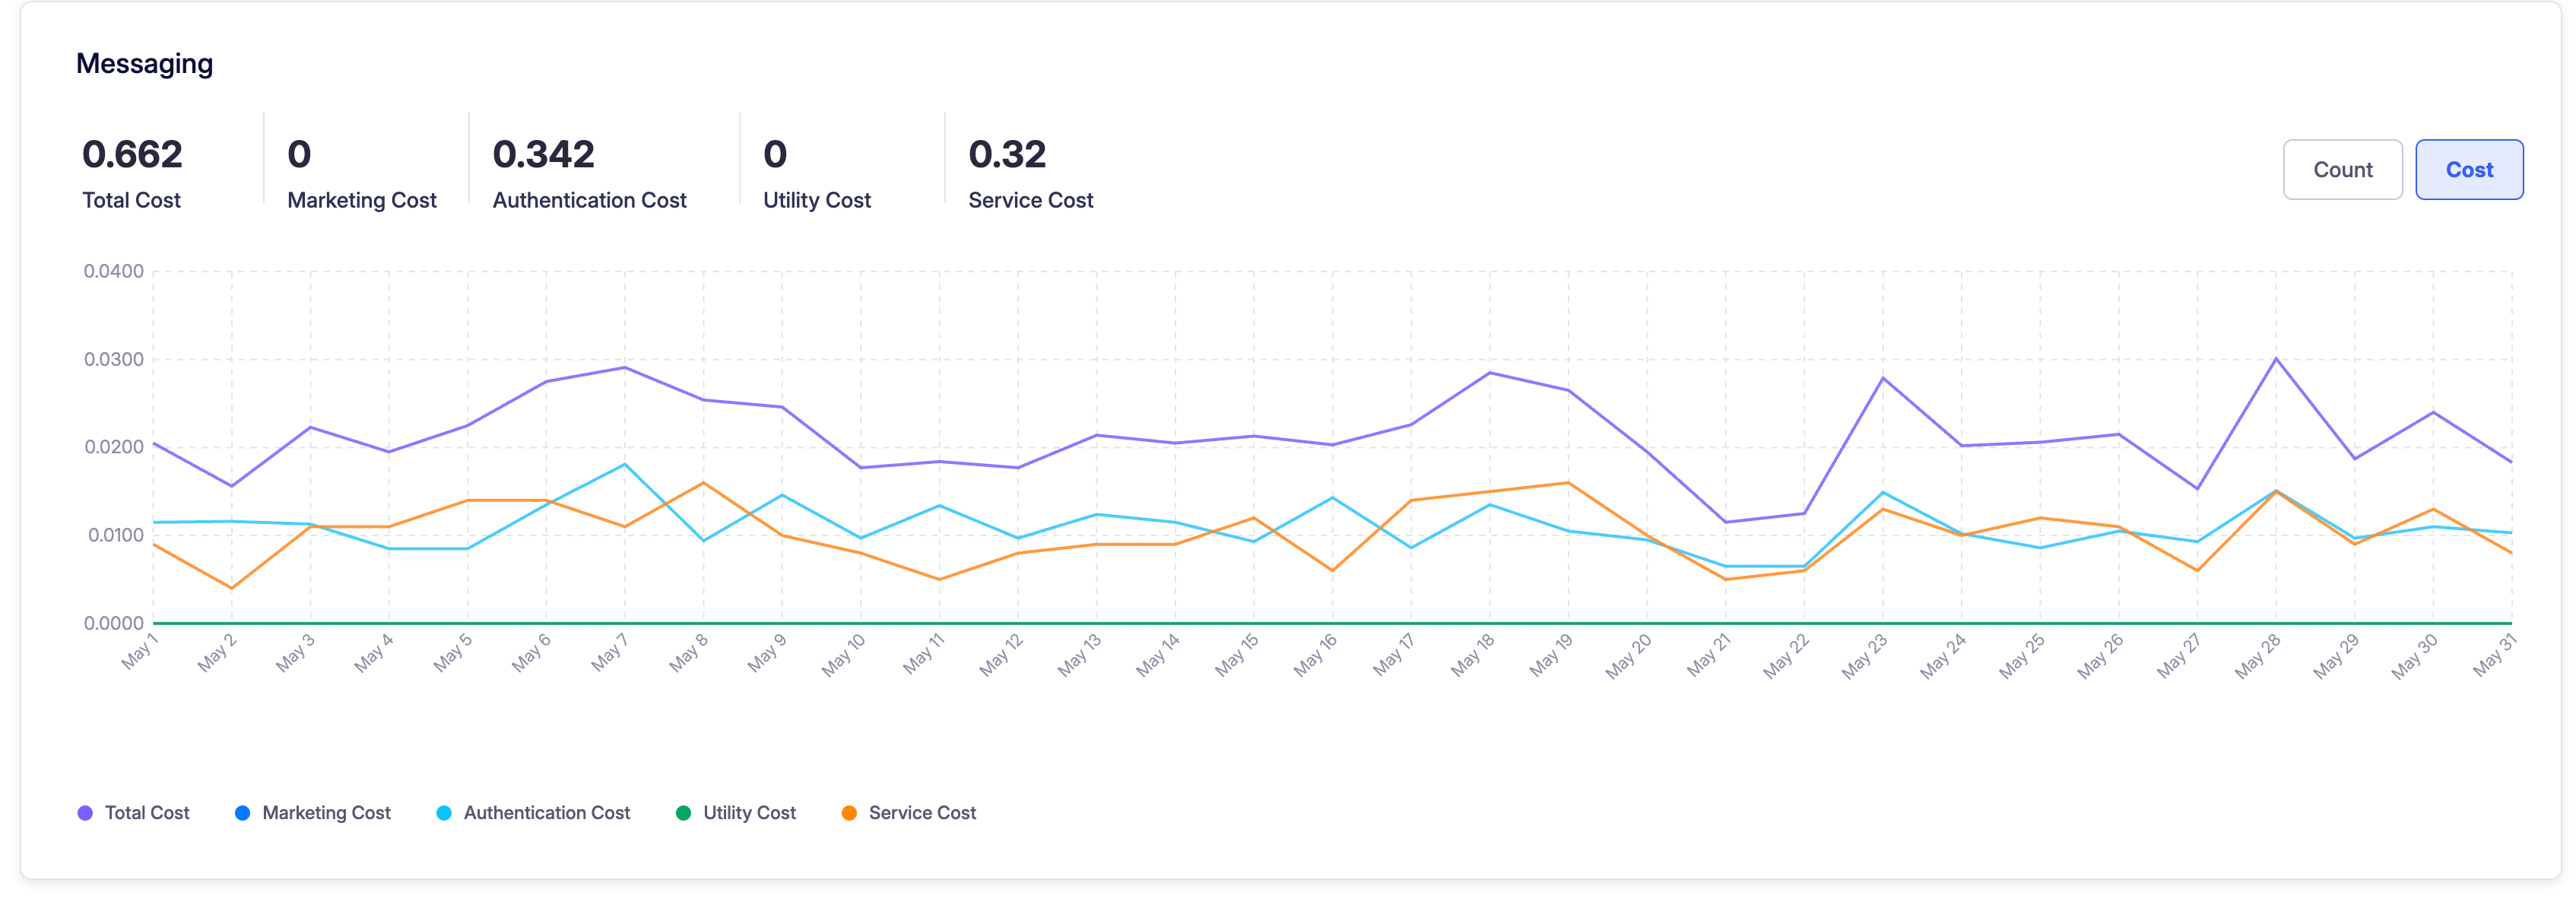
The donut chart on the right side of the chart shows the distribution of template messages by category.Messaging (Cost Chart)
Messages Breakup
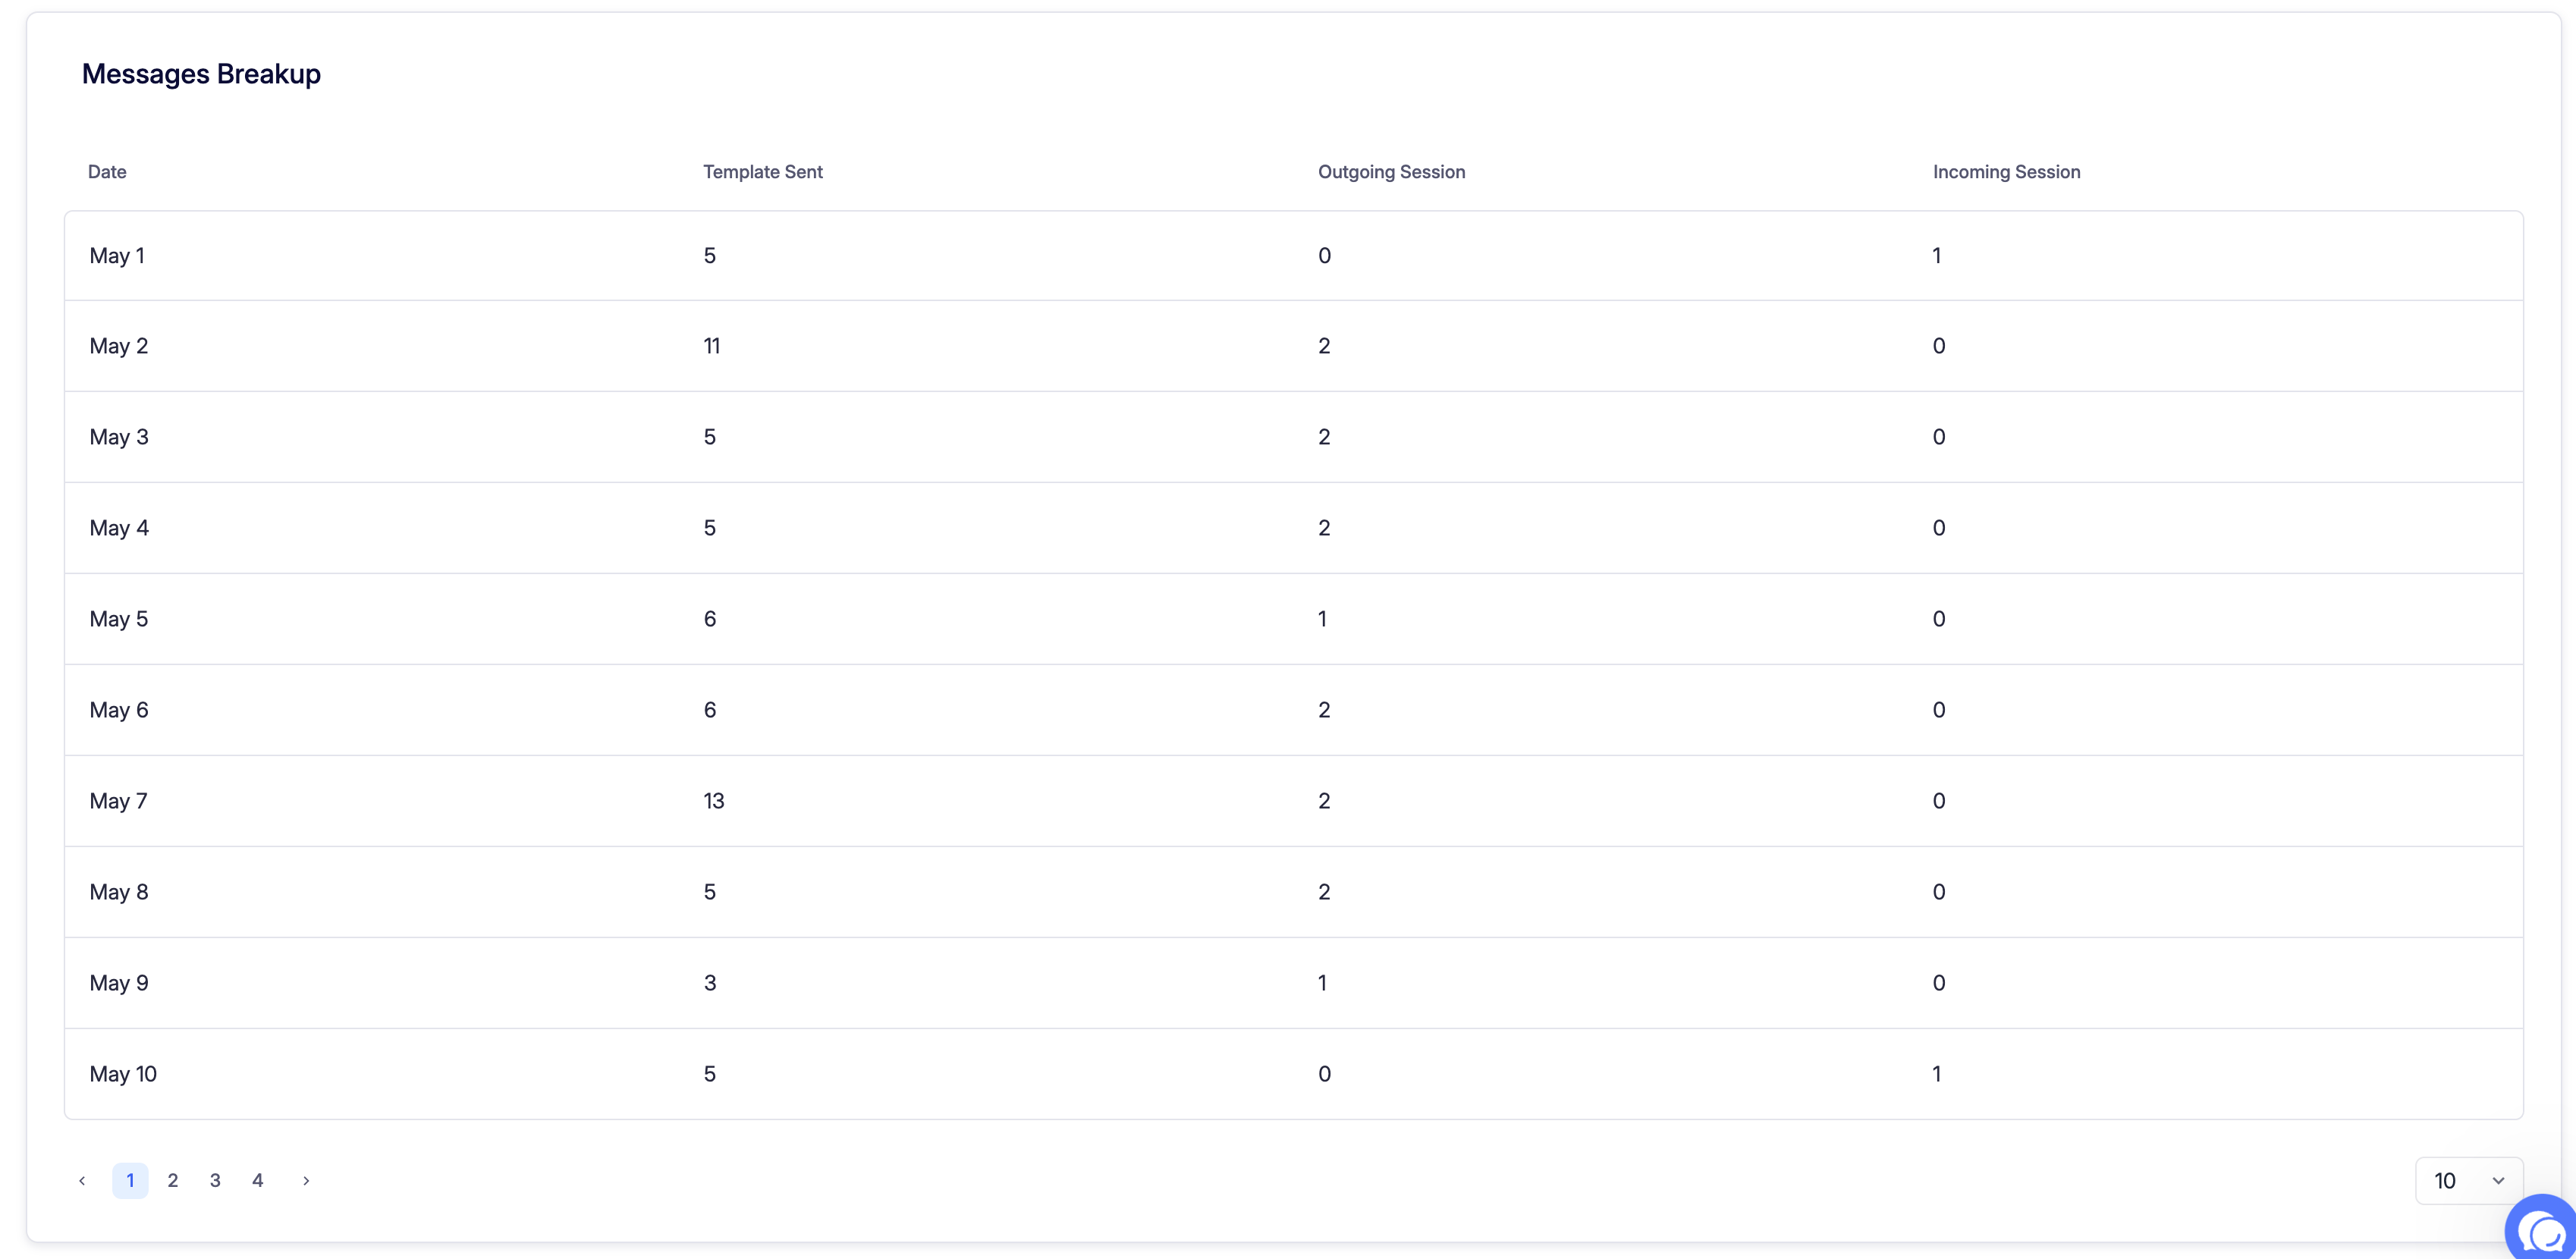
Use the pagination below the table to navigate between days. Use the dropdown at the bottom right to change the number of rows shown per page.
Template Breakup
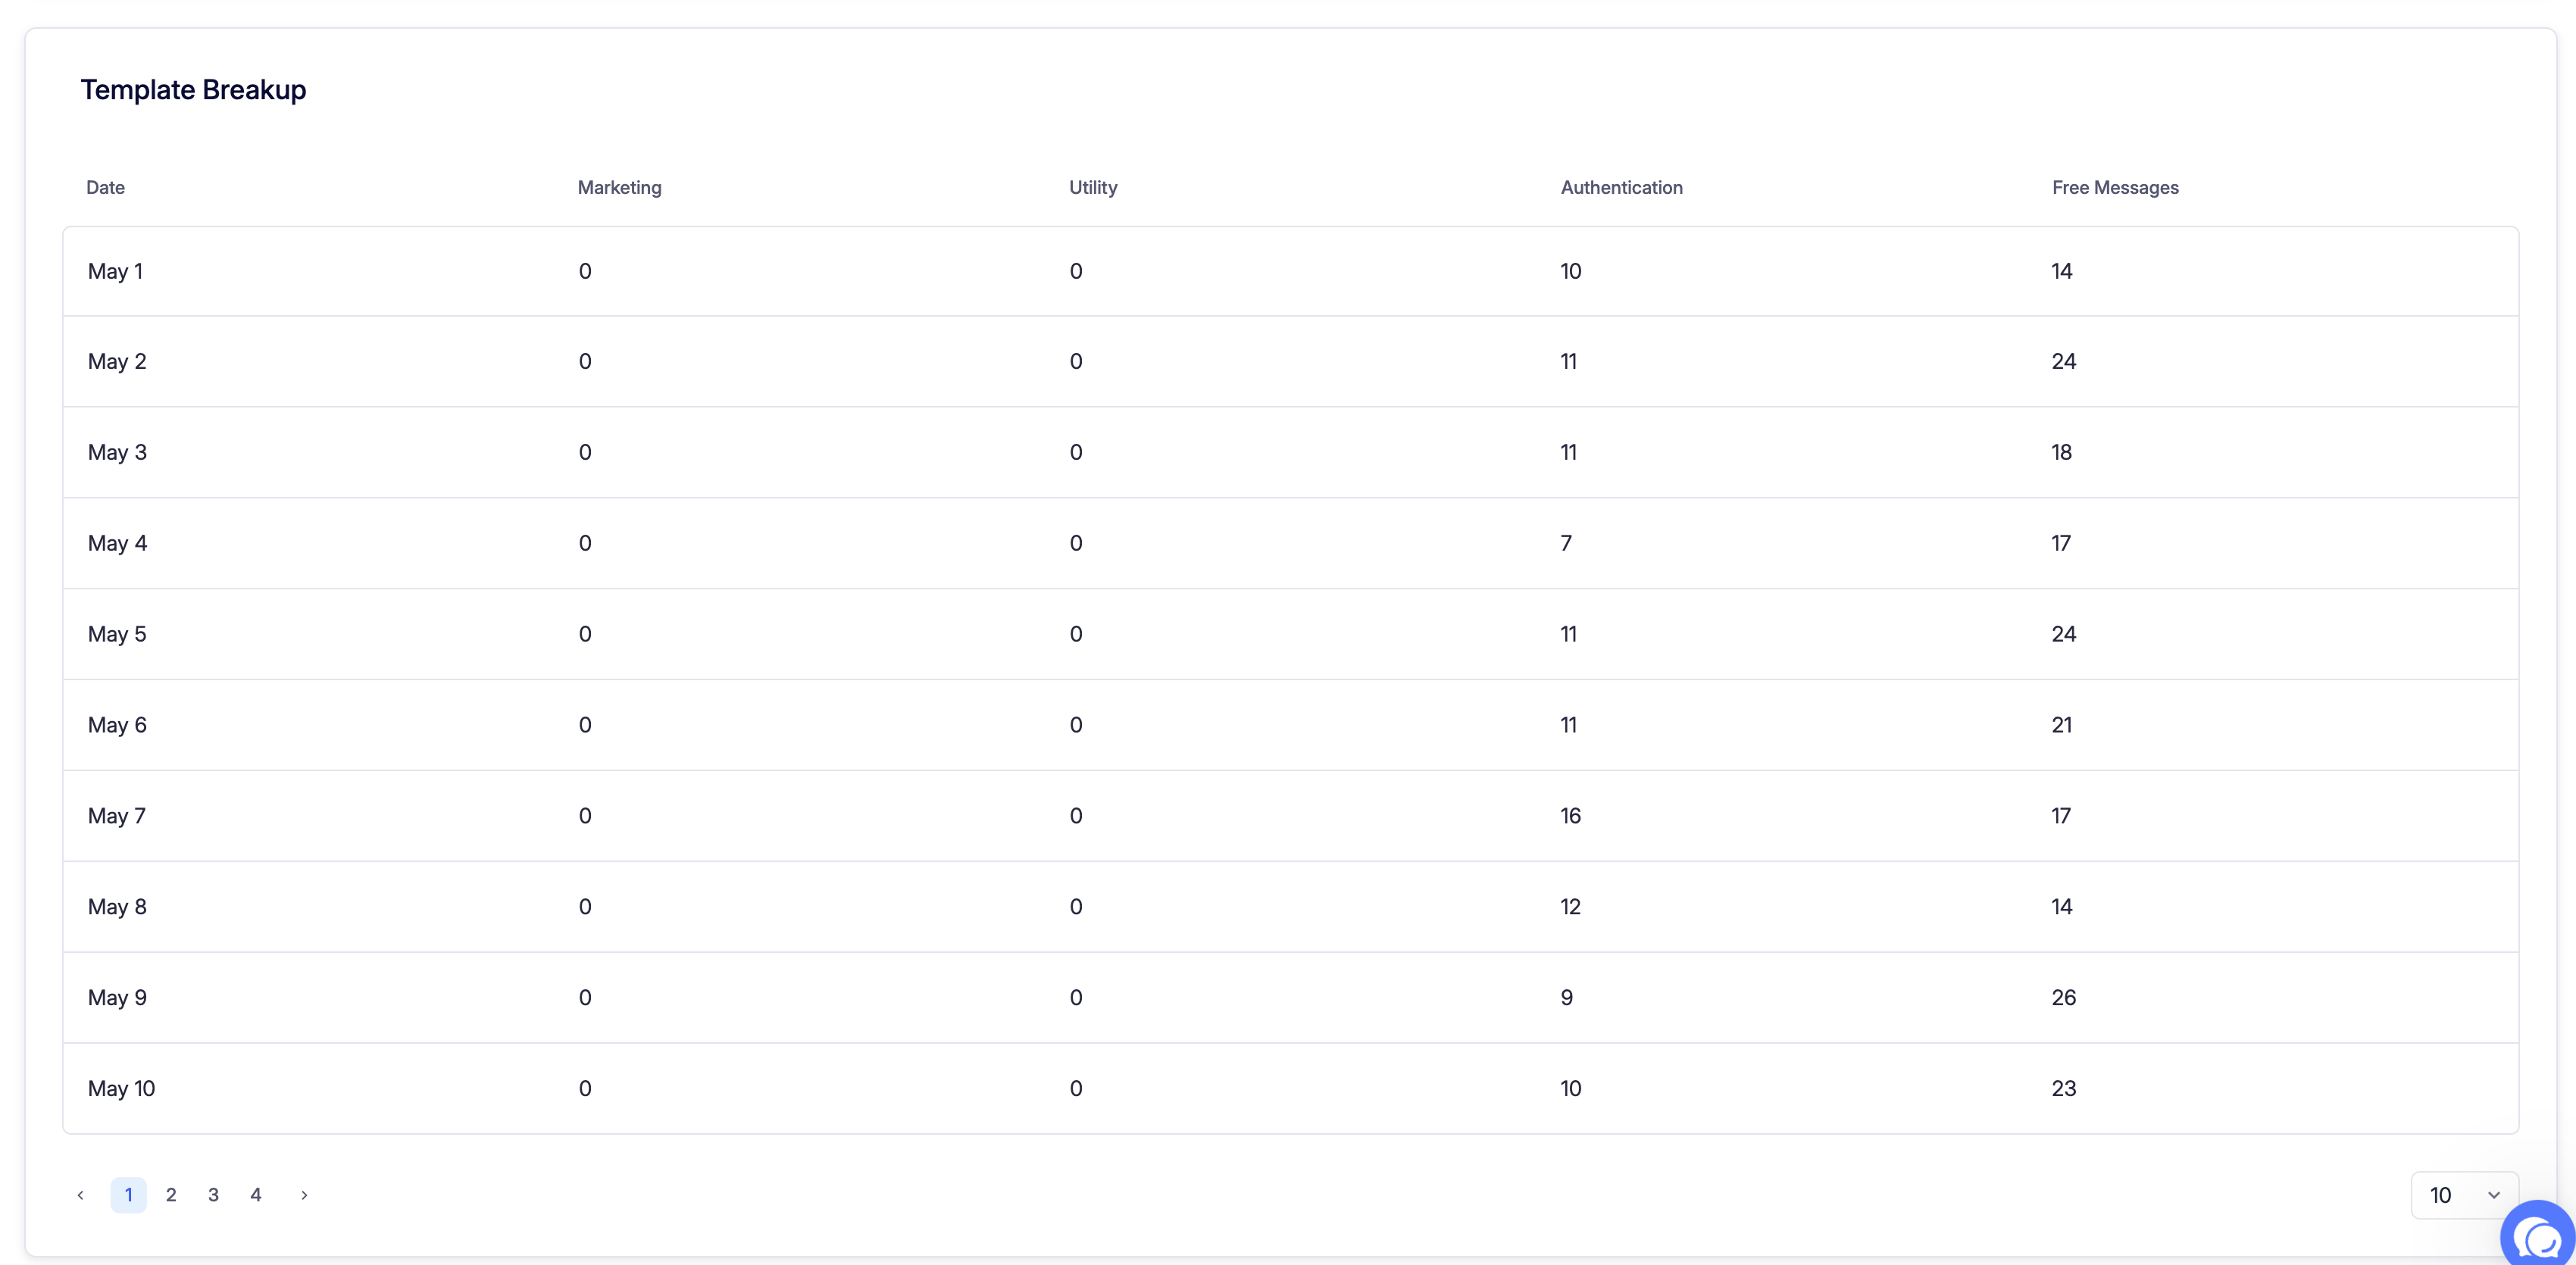
Export
Click the Export button in the top right corner to export data.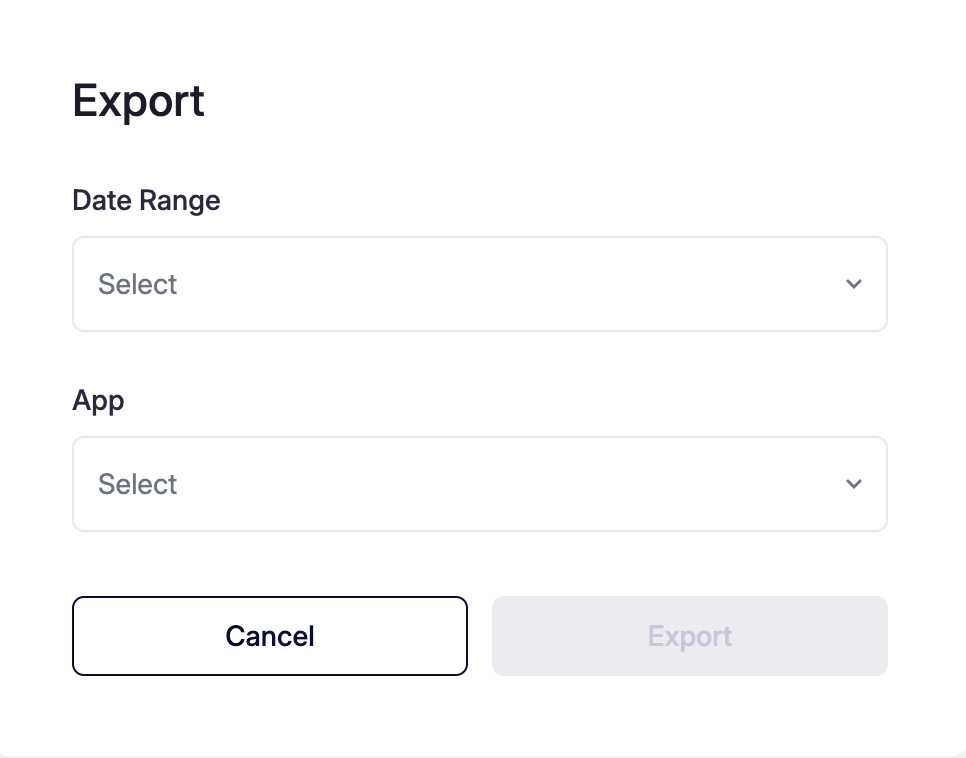
After filling in both fields, the Export button becomes active. Click it to download the report.