For a quick summary across all channels and apps, see the Dashboard.
Insights officially starts on November 1, 2026. Data shown for earlier dates is a preview and may be incomplete.
Open Insights
Select Insights in the left menu.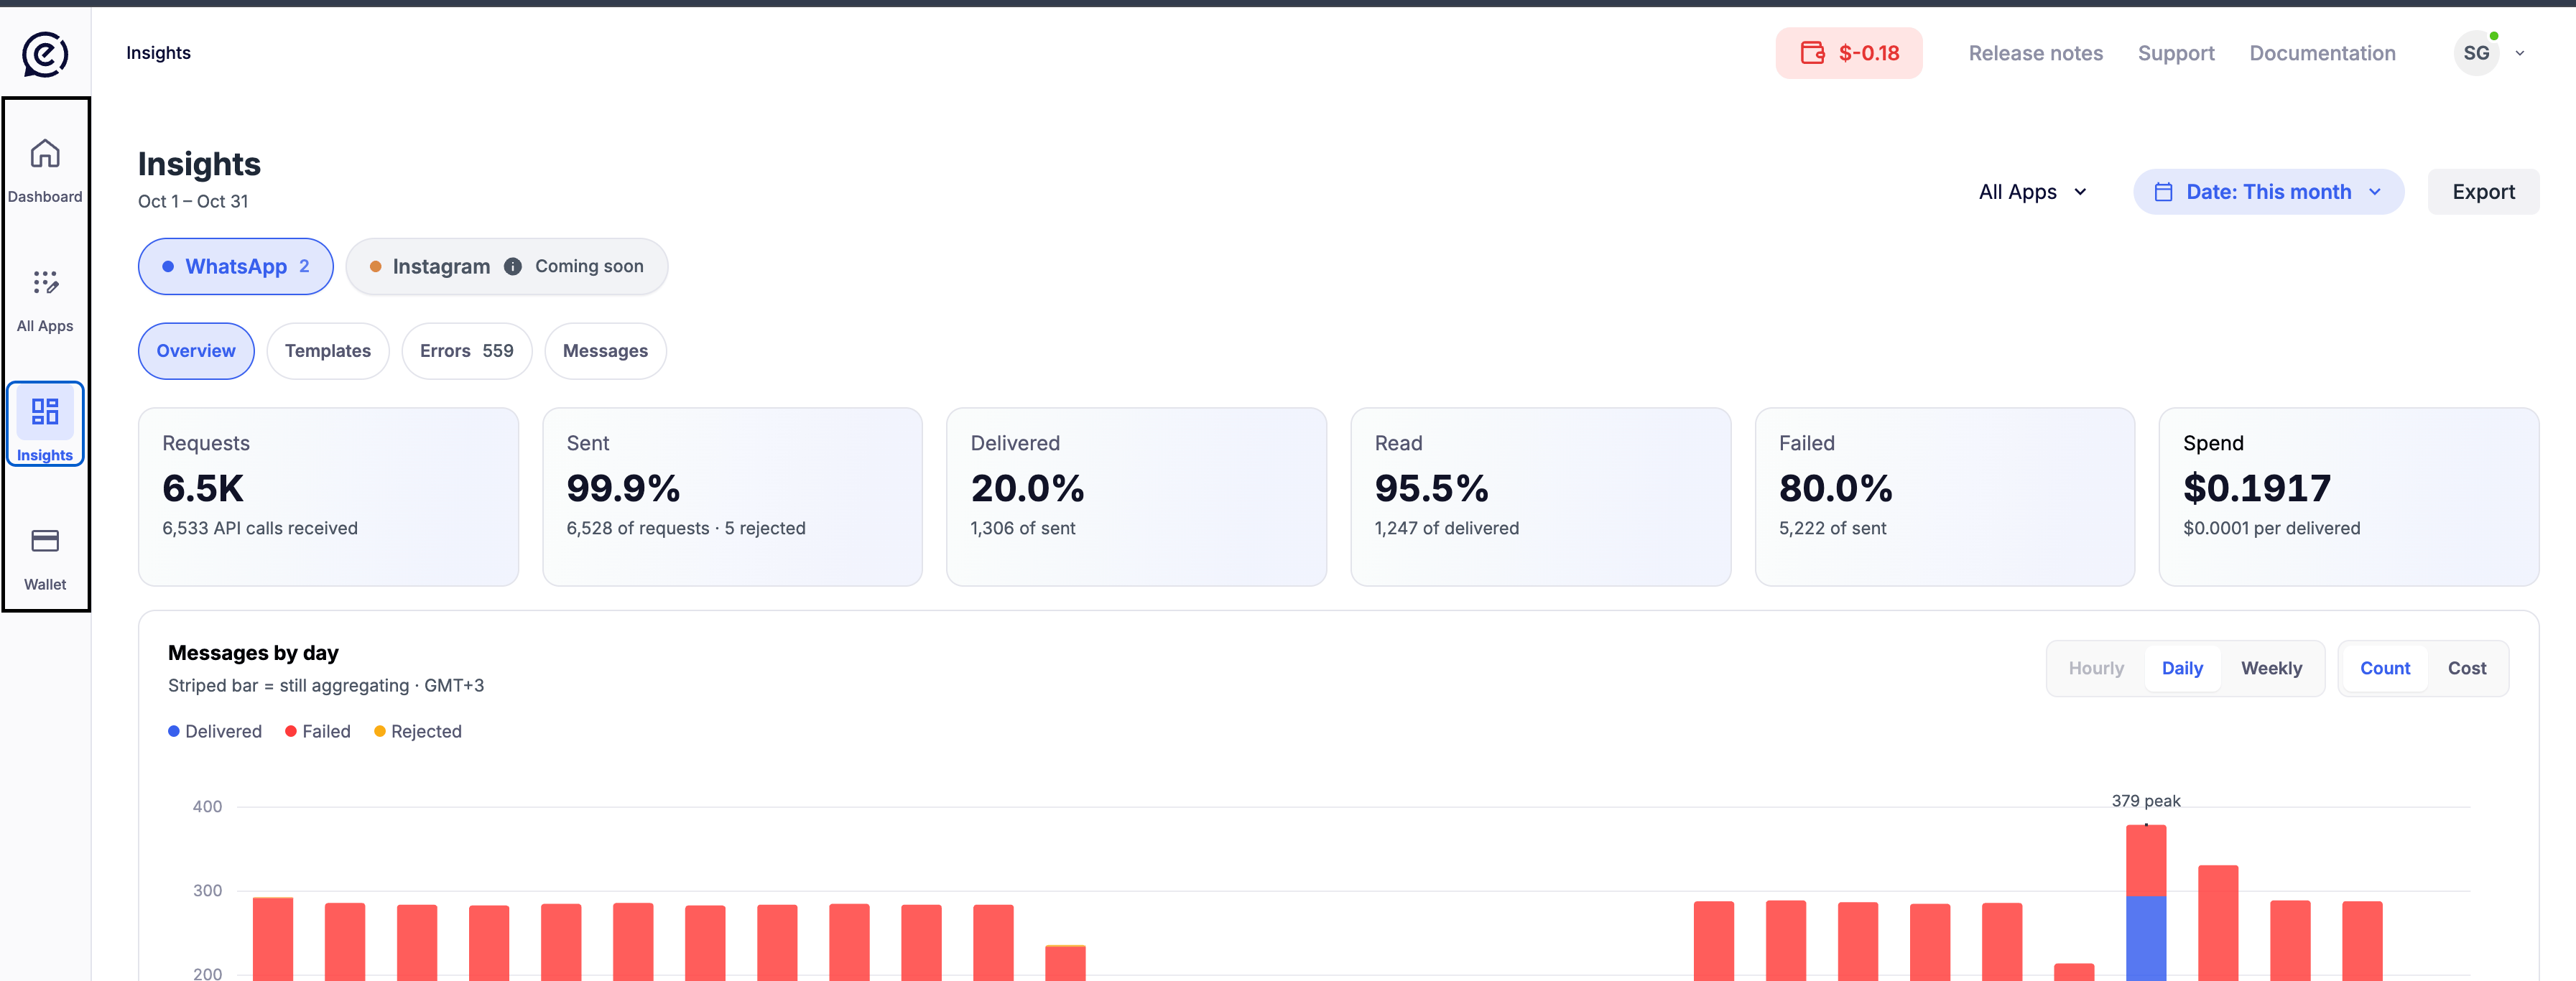
Page controls
The controls at the top of the page apply to all four tabs.Channel
Select the channel to analyze. The number next to WhatsApp shows how many WhatsApp apps you have. Instagram is marked Coming soon and is not yet available in Insights.Filters
The selected date range is shown under the page title, for example
Oct 1 – Oct 30.
Date filter
Click the Date button to open the date picker.
After making your selection, click Save Filter.
Export
Click Export to download a report.
After you fill in both fields, the Export button becomes active. Click it to download the report.
Summary
The cards at the top of the Overview tab follow a message from the moment Gateway receives the request until it is read.
Messages by day
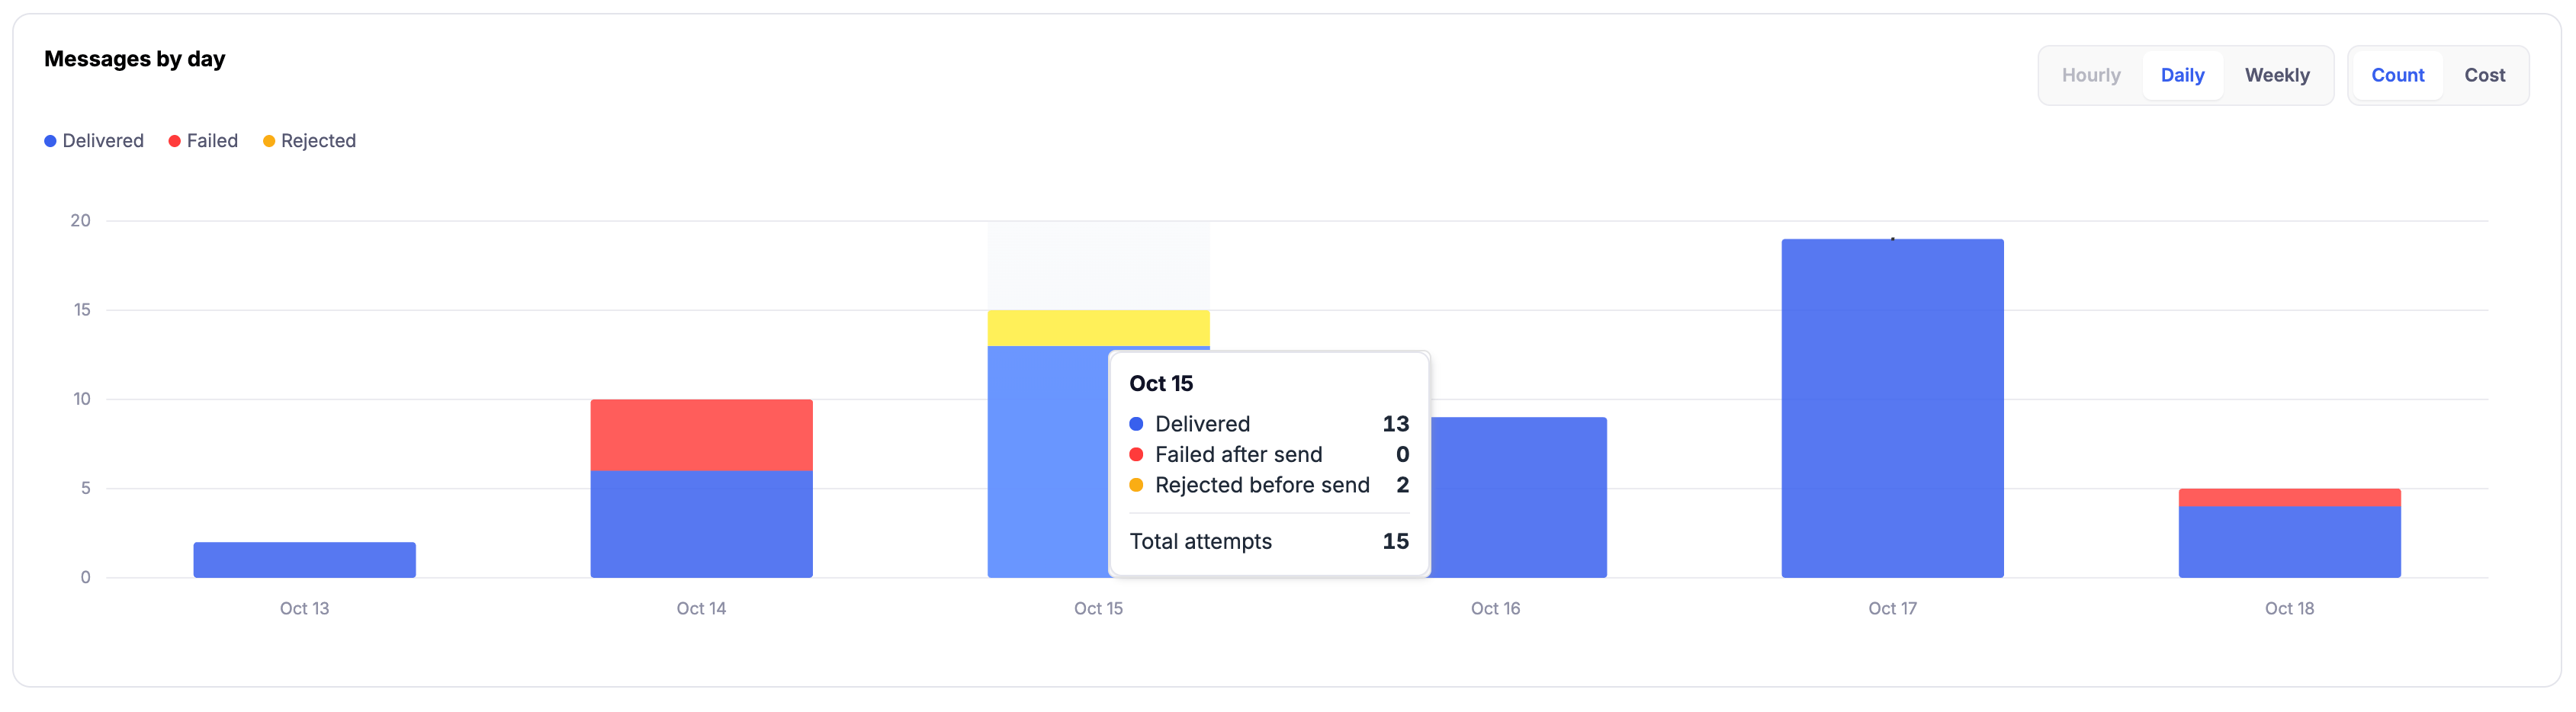
Use the controls in the top right corner of the chart to change the view:
The highest bar is labeled with its value, for example
379 peak. A striped bar means the data for that period is still being aggregated. The time zone of the chart is shown under the title.
Where messages fail
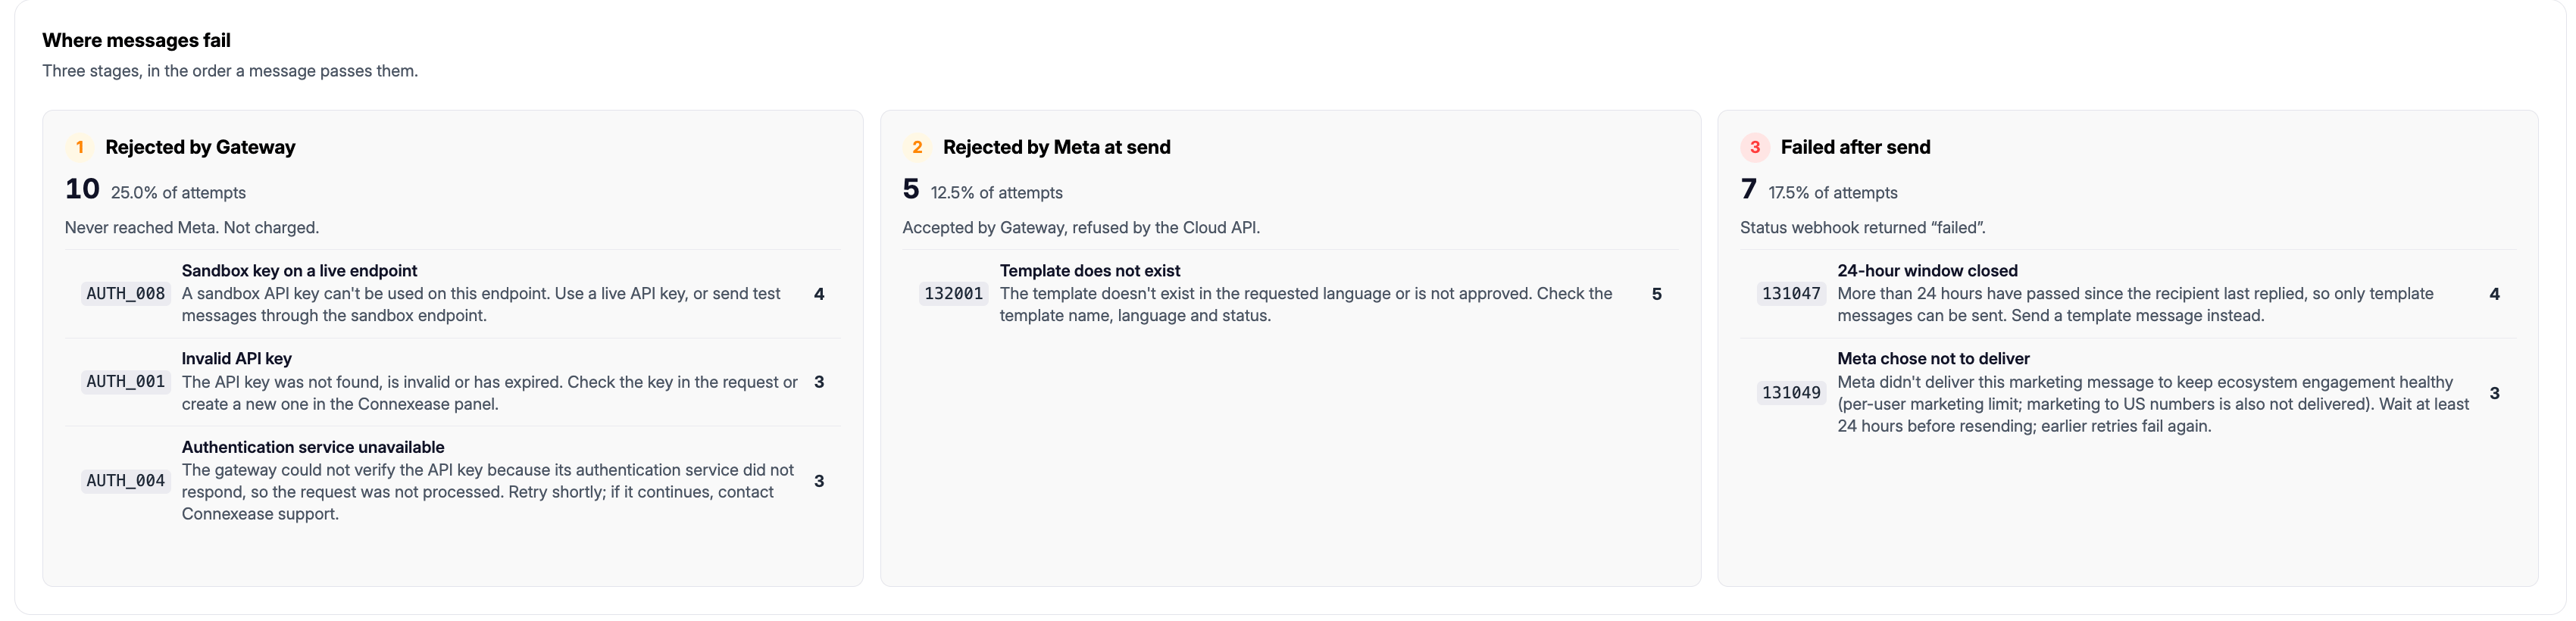
Each stage shows the number of affected messages and their share of all attempts. Below that, it lists the error codes in that stage, each with a short explanation and its count. For a full breakdown, see the Errors tab.
Messages by category

Each row shows the number of messages and their share of the total, the estimated total cost, and the average cost per message.
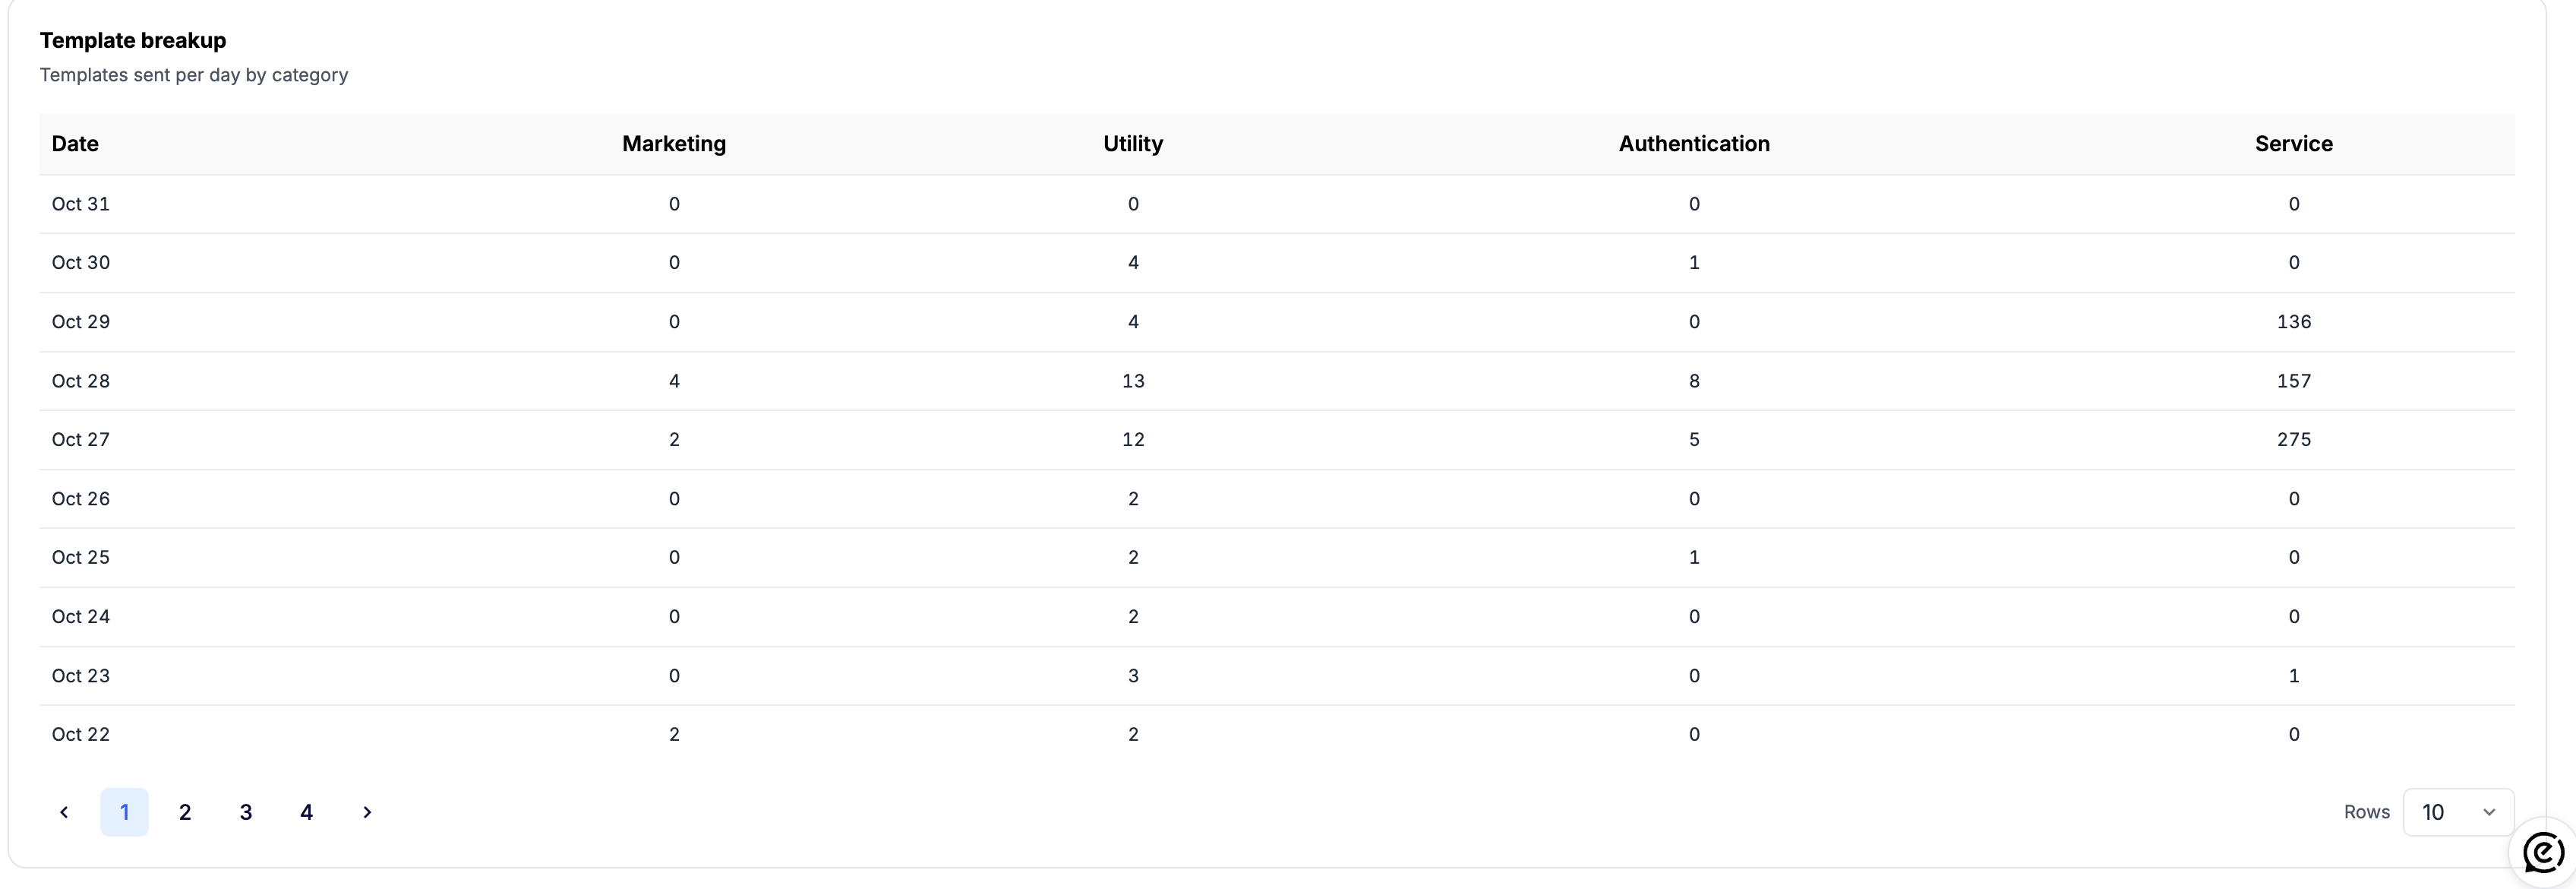
Messages breakup
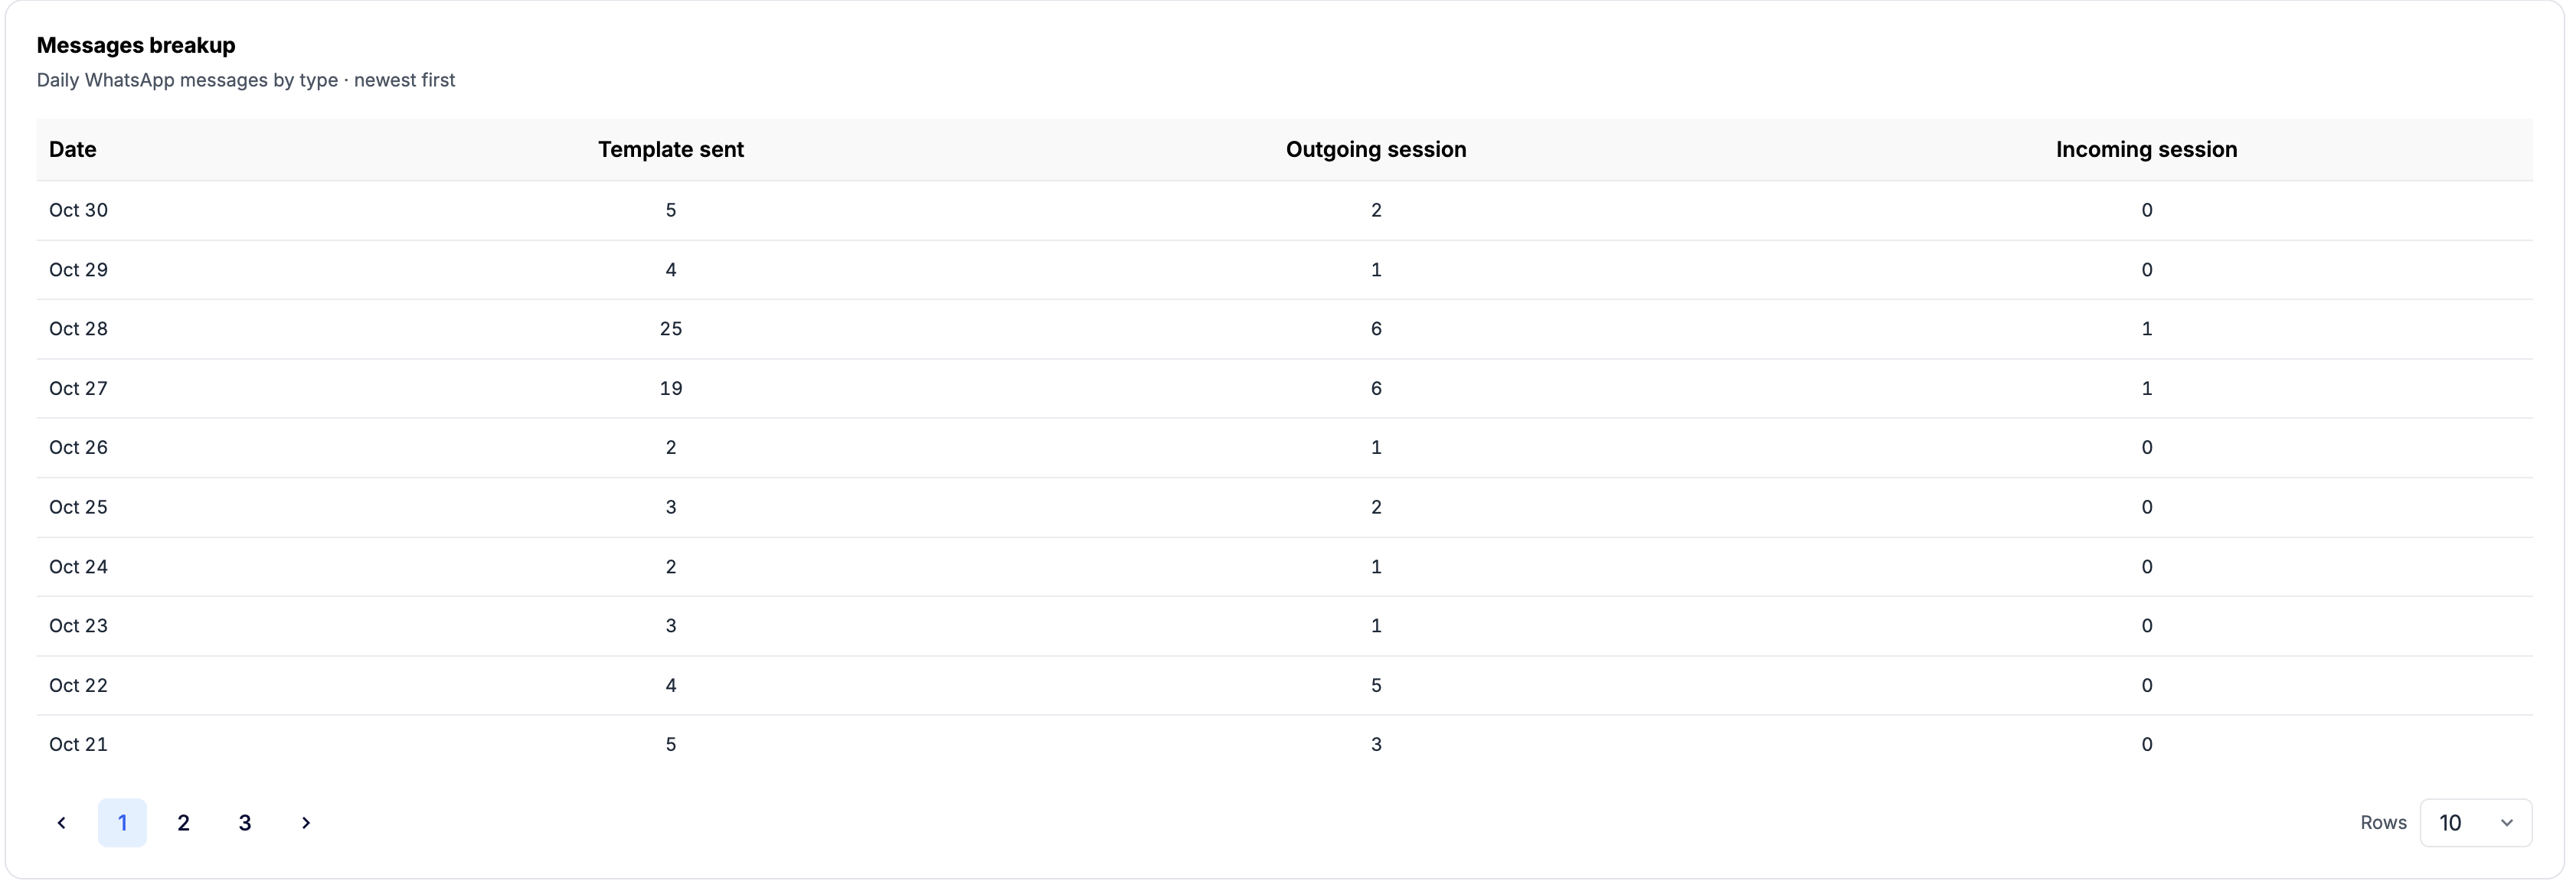
Use the page numbers below the table to move between pages, and the Rows dropdown to change how many rows each page shows.
Template breakup